import datetime

current_time = datetime.datetime.now()  # Use the module 'datetime' from the package 'datetime'
print("This notebook was created on:", current_time)
This notebook was created on: 2026-09-25 14:47:18.571154A variable can not only hold numbers and text strings, but also more complex, composite data such as dates, tables or images. Working with this kind of data requires importing specialized packages, such as the datetime package:
import datetime
current_time = datetime.datetime.now() # Use the module 'datetime' from the package 'datetime'
print("This notebook was created on:", current_time)This notebook was created on: 2026-09-25 14:47:18.571154External course material
Review this tutorial about the
datetimepackage: https://www.w3schools.com/python/python_datetime.asp, and do the exercise: https://www.w3schools.com/python/python_challenges_datetime.asp.
The dot (.) is used to access functions and member variables of specific modules and composite datatypes. For example, current_time.year can be used to read the year from the variable current_time:
print("The year was:", current_time.year)
print("Next year is:", current_time.year + 1)
The year was: 2026
Next year is: 2027Some composite datatypes even allow computation. The datetime package, for example, allows calculations with time differences. Note how the package takes leap years into account:
in_ten_years = current_time + datetime.timedelta(days=10 * 365)  # Use the function datetime.timedelta to add 10× 365 days
print("AI has taken over the world in:", in_ten_years)
AI has taken over the world in: 2036-09-22 14:47:18.571154The package also makes sure that all dates and times are valid. Note how it checks the input arguments and raises an error when we try to create an invalid date. The error message traces back the origin of the error, and shows the reason in the last line:
leap_day = datetime.datetime(2024, 2, 29)
not_a_leap_day = datetime.datetime(2026, 2, 29)
--------------------------------------------------------------------------- ValueError Traceback (most recent call last) Cell In[4], line 2 1 leap_day = datetime.datetime(2024, 2, 29) ----> 2 not_a_leap_day = datetime.datetime(2026, 2, 29) ValueError: day 29 must be in range 1..28 for month 2 in year 2026
External course material
Just like the specialized
datetimepackage, Python comes with many more modules that provide functions and composite datatypes for tasks in everyday programming. A few frequently used ones are:
- math: Math functions: trigonometry, logarithms, constants, etc.
- pathlib: Work with filesystem paths.
- random: Functions for generating pseudo-random numbers.
- statistics: Functions for calculating mathematical statistics of numeric data.
Review these webpages and do the exercises at the top of each page.
These modules are part of the Python standard library that is distributed with every Python installation.
The ‘import’ keyword
In the example above we used import datetime. After running that command, the entire datetime module is available, meaning that we can use e.g. datetime.timedelta, datetime.time, datetime.datetime.now, and everything else in the module.
The ‘from’ keyword
Sometimes just one specific function or datatype from a module is used, in which case we can be more specific and run e.g. from datetime import timedelta. Now, only timedelta is available. If you need several things from a module, you can use a comma to seperate these things: from datetime import timedelta, time. Note that using from ... import ... instead of import ... is primarily a code organization/readability choice. It is not meaningfully faster or better in any other way.
The ‘as’ keyword
Although meaningful variable names are preferred, short names can be more convenient. By running import datetime as dt, the datetime module is now available under the alias dt, meaning we should use e.g. dt.timedelta instead of datetime.timedelta. For some packages, this has become standard practice, e.g. import numpy as np and import pandas as pd.
Variables allow us to do computations and manipulate complex data. But once a computer program quits, the variables and their values, which are stored in the computer’s volatile memory, are gone. In order to preserve the information, we need to write and read the data to non-volatile storage such as a local-, network-, or cloud-storage drive.
A very frequently used Python package to work with tabular data (spreadsheets, tables) is pandas. The pandas package allows creating, manipulating, reading, and writing various standard tabular file formats, such as Excel, SPSS, and CSV (comma-separated values). Note that saving a file in such a standard format allows transferring data between Python and other programs.
The pandas package is not part of the Python standard library, but it is available through the Python Package Index (PyPI); a repository of software packages for Python. All the packages found there can be installed by running pip install <package name> from the terminal.
The code below shows a simple example of how pandas can be used to create, write, and read a table.
import pandas as pd  # Abbreviate 'pandas' as 'pd', which has become standard practice.

# Create a simple pandas DataFrame (a table).
tissue_volumes = pd.DataFrame(data={"Volume": [723, 512, 183]},  # Column header and row values
                              index=["Gray matter", "White matter", "CSF"])  # Row indices
tissue_volumes.index.name = "Tissue type"  # Row index title

# Save the DataFrame to a CSV file.
tissue_volumes.to_csv("tissue_volumes.csv")
# Load the CSV file and display the table.
loaded_volumes = pd.read_csv("tissue_volumes.csv", index_col="Tissue type")
loaded_volumes| Volume | |
|---|---|
| Tissue type | |
| Gray matter | 723 |
| White matter | 512 |
| CSF | 183 |
# Lookup the gray matter volume and convert it to liters.
tissue = "Gray matter"
print(tissue, ":", loaded_volumes.loc[tissue, "Volume"] / 1000, "L")
Gray matter : 0.723 LNote: by default the csv files will be saved in the folder on your hard drive where you started the virtual environment (in this manual: pmi). If you want to save the file in a specific folder, you can specify the full path, e.g. by using tissue_volumes.to_csv("c:/data/tissue_volumes.csv").
In order to do calculations on tabular or multidimensional data such as images, we require the package NumPy. NumPy provides fundamental data types and functions for scientific computing with Python. This package provides much of the basic functionality that MATLAB has.
Several other packages provide functions for conversion to NumPy arrays, or even use NumPy arrays for storing multidimensional data (the numpy.ndarray) within their own data types.
For example, the table we created above, can be converted into a NumPy array simply by calling to_numpy:
array = loaded_volumes.to_numpy()
print(type(array))
<class 'numpy.ndarray'>This NumPy array allows us to do array operations like this:
import numpy as np

print("Half tissue volume: ", array / 2)
print("Total volume:", np.sum(array))
Half tissue volume: [[361.5]
[256. ]
[ 91.5]]
Total volume: 1418External course material
Review these pages about NumPy arrays and do the exercises:
For working with DICOM images we need to import yet another module. There are several packages for Python that can read and write DICOM files, but pydicom is most frequently used.
The pydicom package comes with a few test images. The cell below shows how to read a DICOM file with the dcmread function and assign the DICOM data to the variable dicom_image. Besides the image itself, we can access its metadata, such as the modality, study date, image size, and pixel spacing:
from pydicom import dcmread
from pydicom.data import get_testdata_file

file_path = get_testdata_file("CT_small.dcm")  # Obtain the path to the test image.
dicom_image = dcmread(file_path)  # Read the DICOM image

# Show some metadata.
print(f"     Modality: {dicom_image.Modality}")
print(f"   Study Date: {dicom_image.StudyDate}")
print(f"   Image size: {dicom_image.Rows} x {dicom_image.Columns}")
print(f"Pixel Spacing: {dicom_image.PixelSpacing}")
Modality: CT
Study Date: 20040119
Image size: 128 x 128
Pixel Spacing: [0.661468, 0.661468]The pydicom package provides functions and data types to read, write, and manipulate DICOM data, but it does not contain functionality to display images. To do so, we need the matplotlib package. The cell below shows how to access the image itself and plot it using plt.imshow. The second argument to the function plt.imshow, cmap="gray", tells the function that it should display the image in gray instead of colors, where cmap stands for colormap.
# Plot the image using matplotlib
import matplotlib.pyplot as plt  # Abbreviate 'matplotlib.pyplot' as 'plt'

image = dicom_image.pixel_array  # Get the image data.
plt.imshow(image, cmap="gray")  # Show it using a gray scale colormap.
plt.show()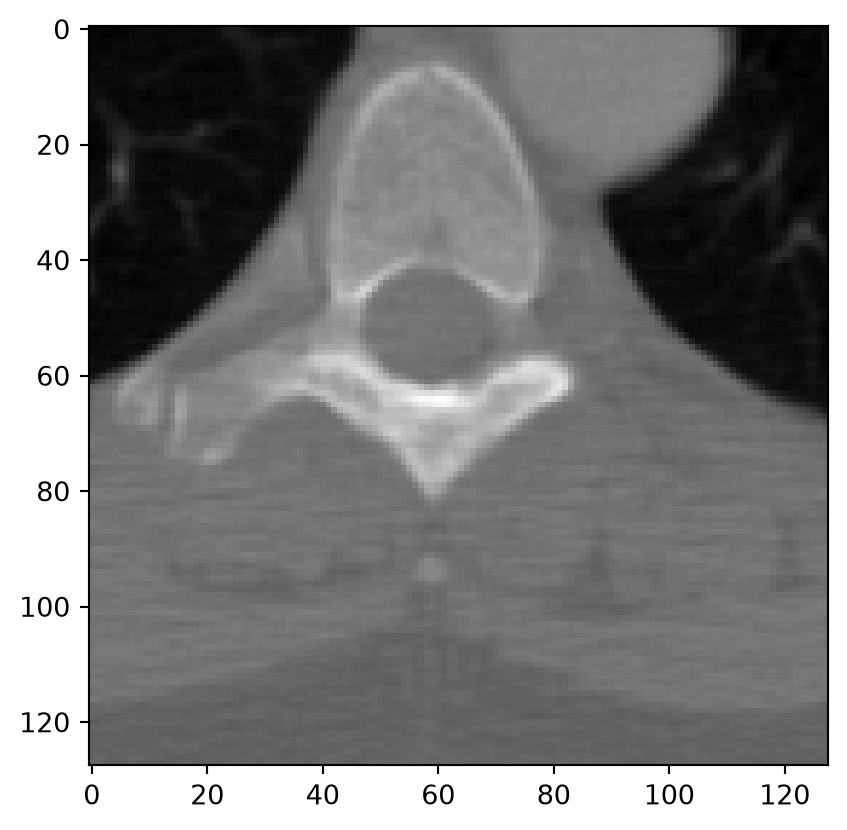
Can you guess what the data type of the pixel array is?
print(type(image)) # Indeed, a NumPy array :-)<class 'numpy.ndarray'>You’ve reached the end of this week’s study material! During Friday’s practical session, you can work on this week’s assignment, which can be found in the course materials.